Centralising reports
An easy way to monitor KPI's and performance
Product
Application
Task
Build an in inhouse billing system
Role
UX/UI
Deliverables
Interactive Prototype, UI, Stakeholder interviews,
"We need a way to align the roadmap to our practice goals"
AS, Practice Lead
The Goal
Currently individual and team KPI's exist in separate locations. Compiling reports from these is a time consuming and manual process. Without timely access to these reports, it is difficult to align a groups performance, to the wider Practice group and to the firms road map goals for the next financial quarter.
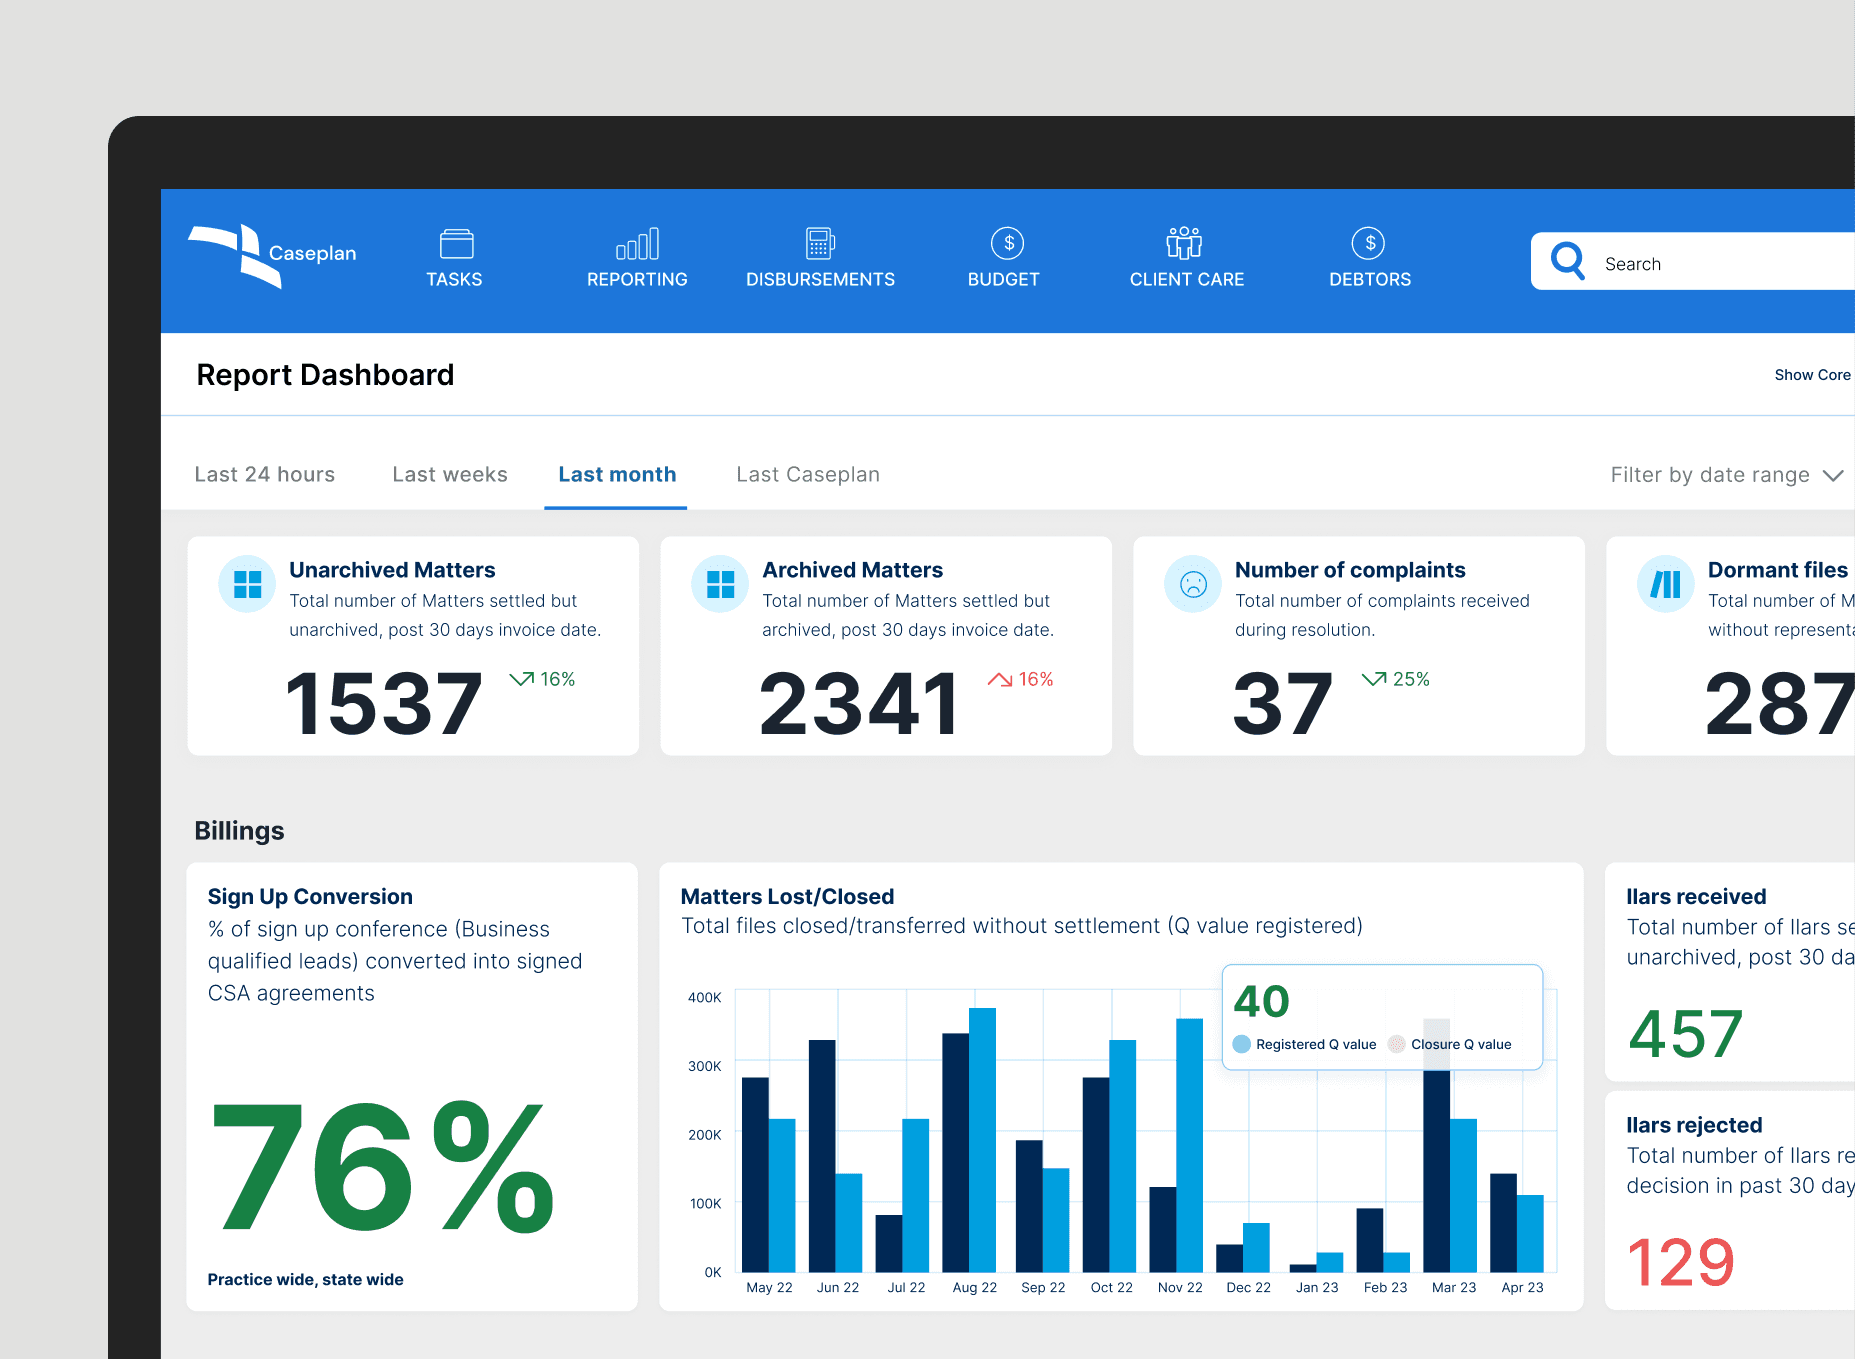
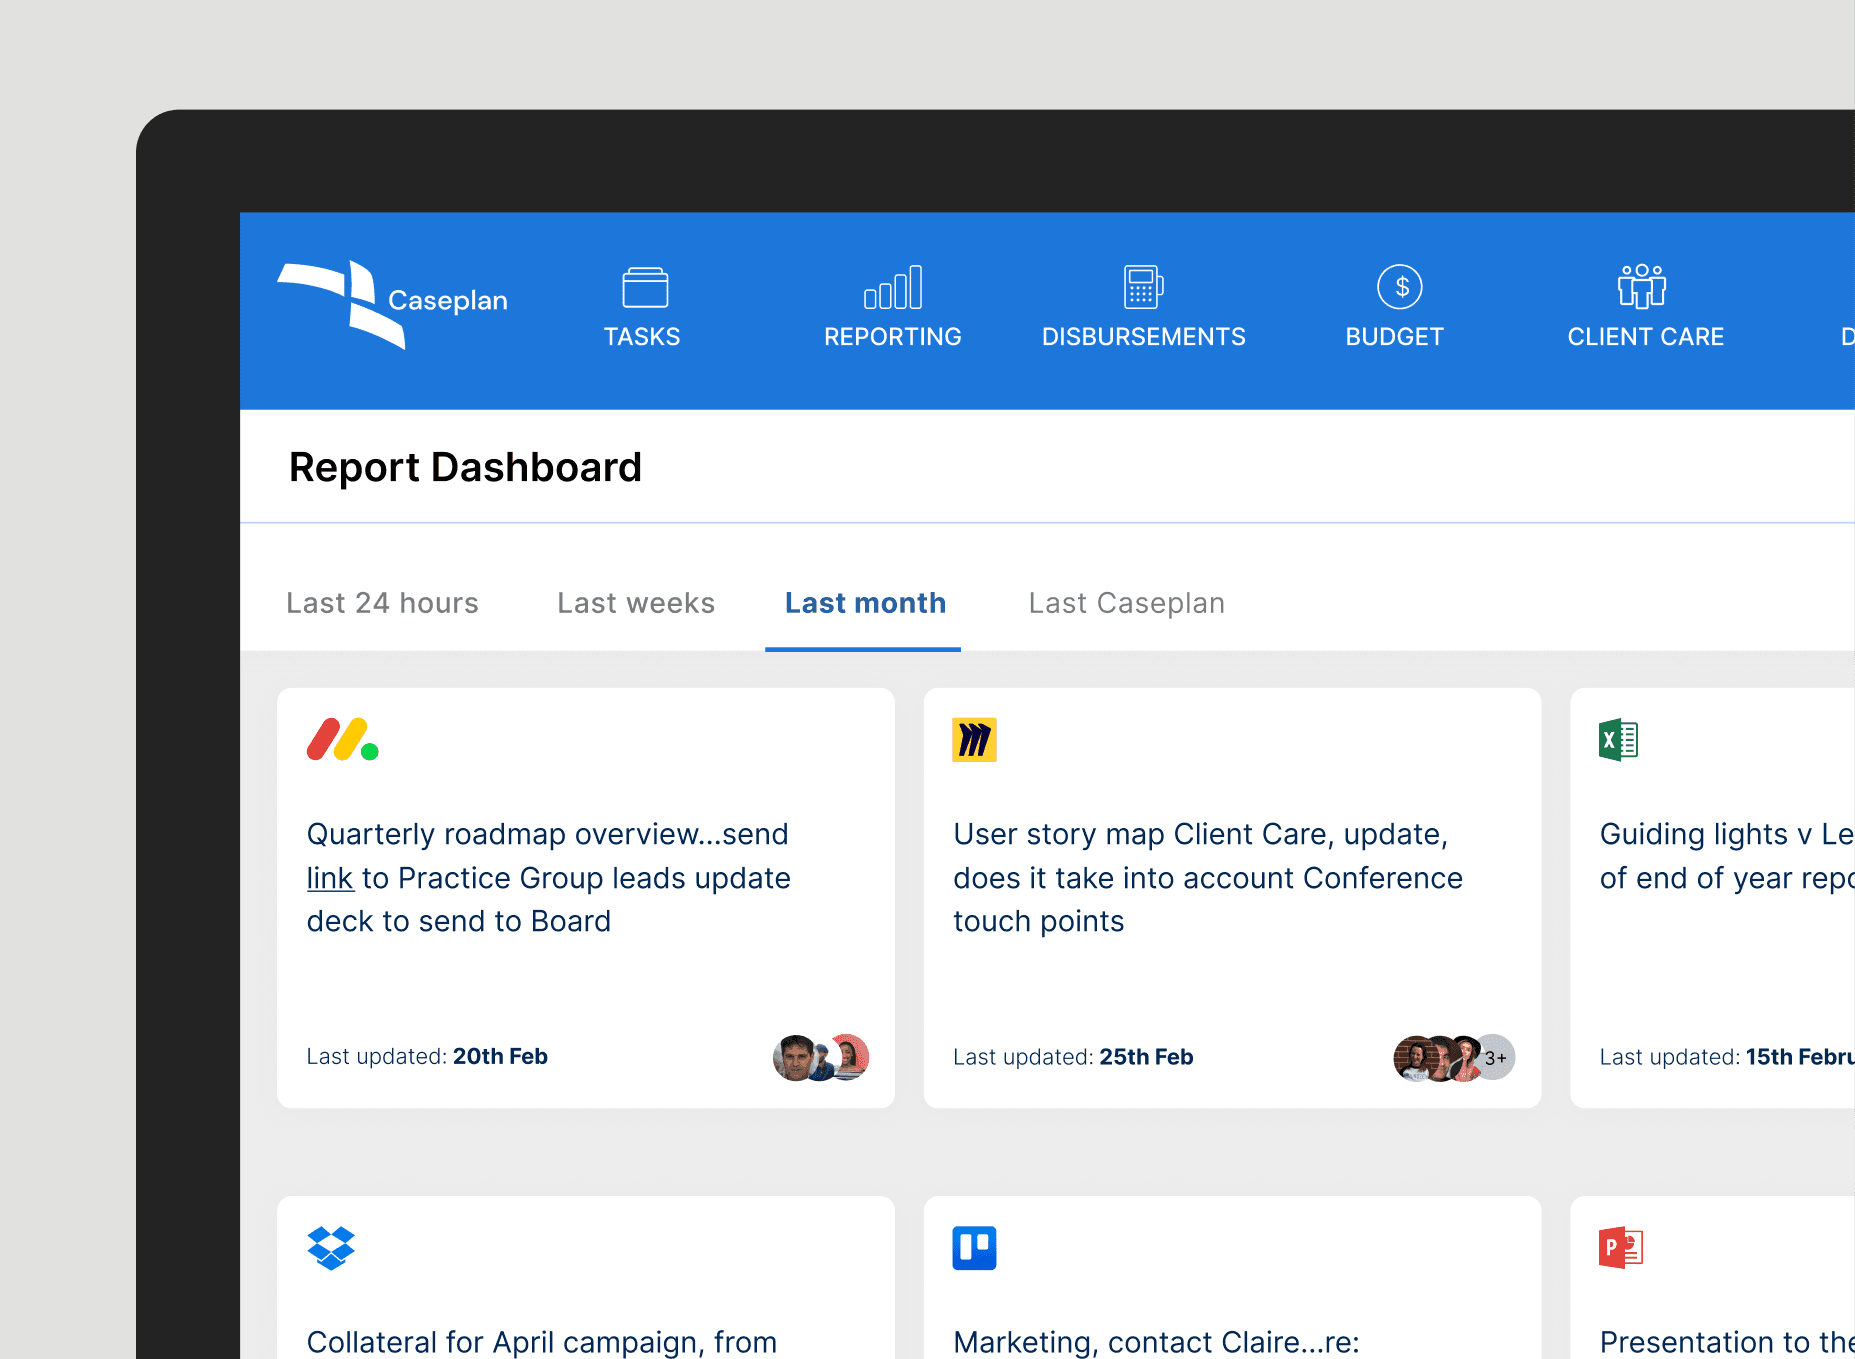
KPI Report page
The challenges
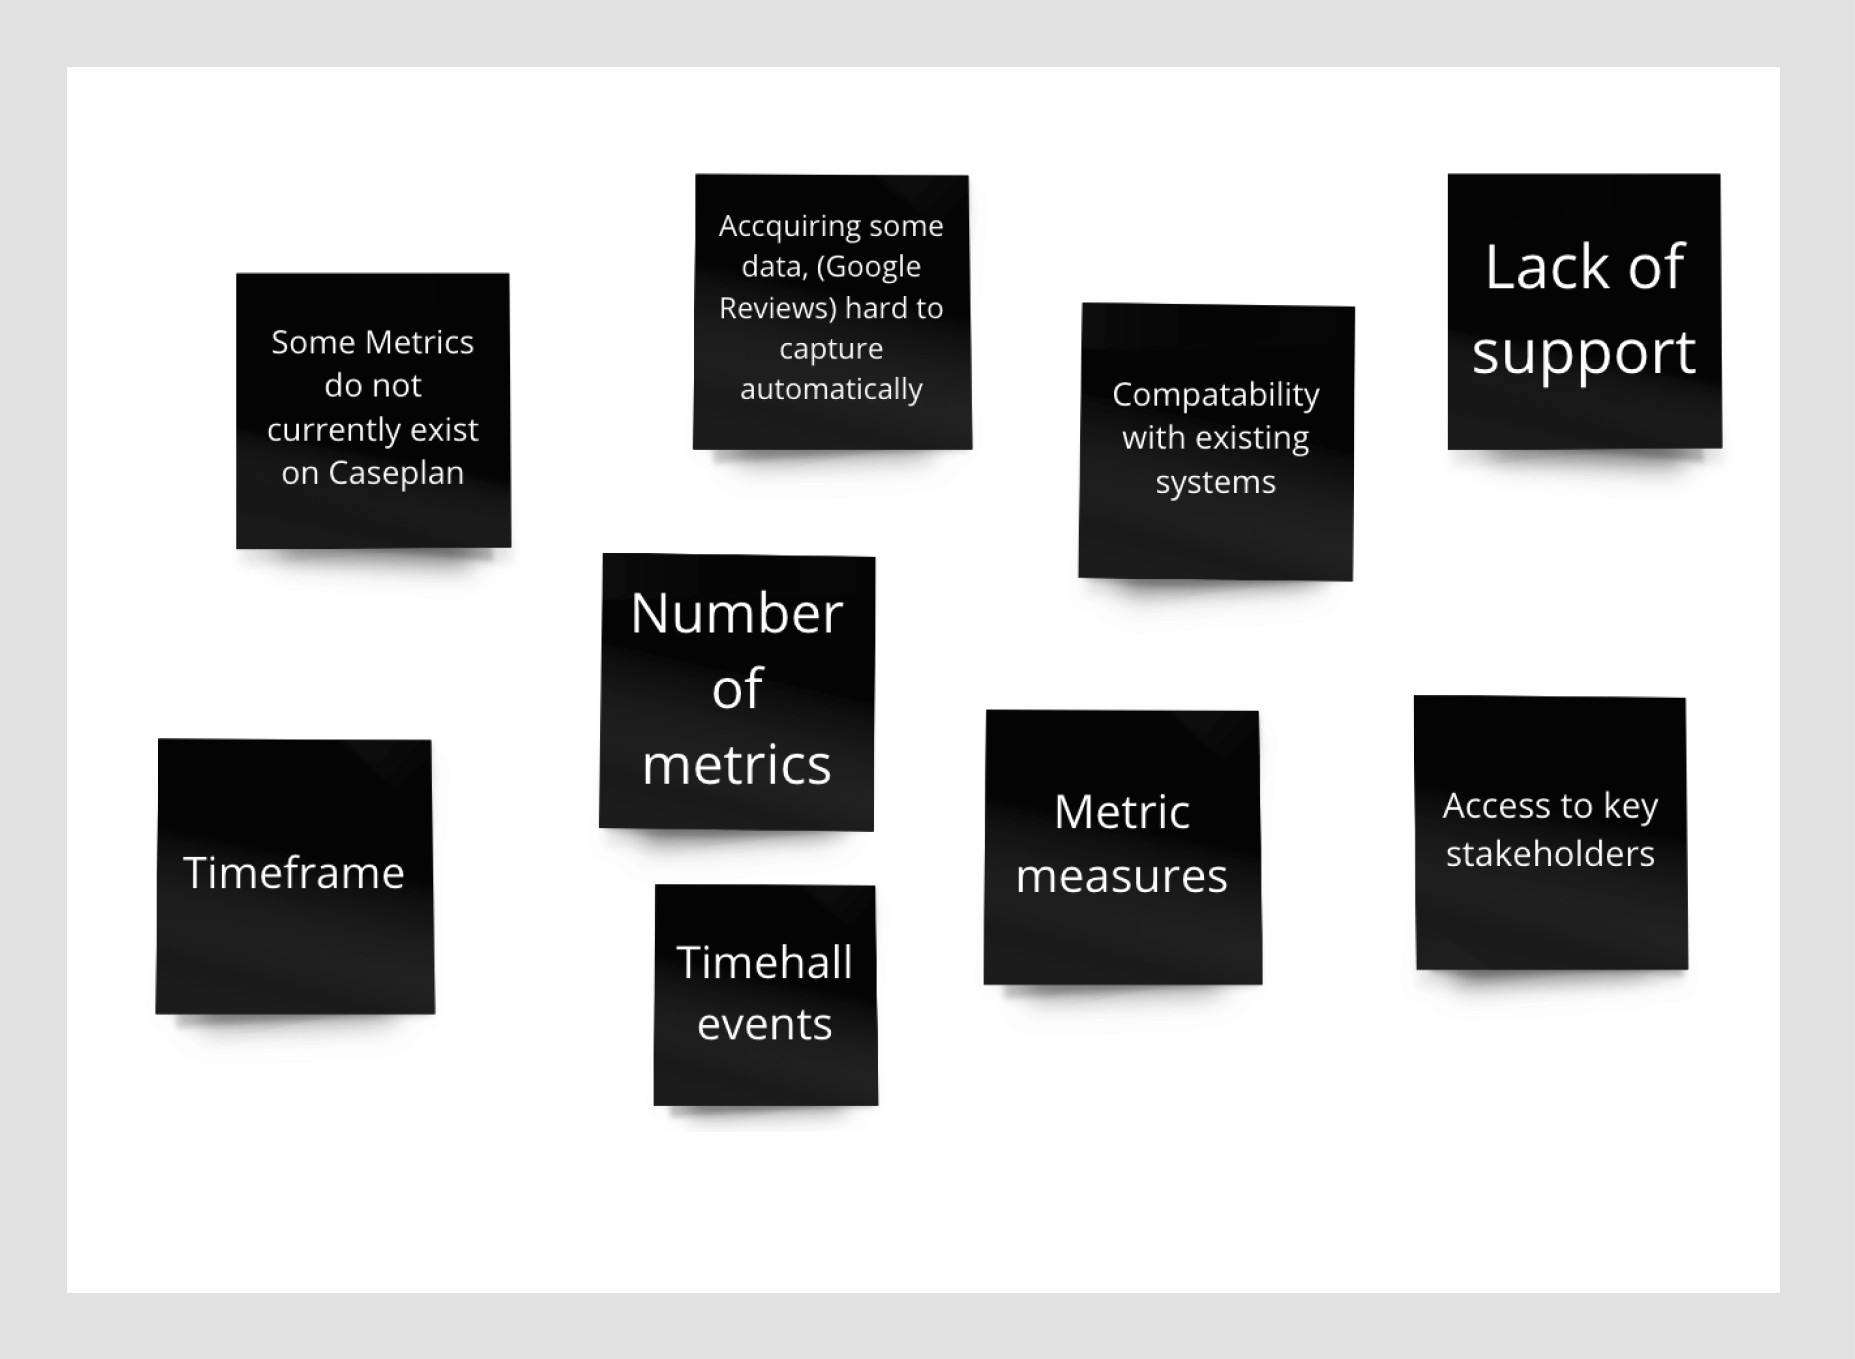
Access to relevant stakeholders proved difficult. A number of the metrics needed did not exist or were in a format that could not be easily extracted. The number of reports needed, I/we felt were excessive. At the outset of the project, I established best practice principals, amongst these was the need for the dashboard to be meaningful (data that conveys what the user wants to see) and simple (data is presented in an easy too understand format)..the number of metrics desired goes against these.
The solution
A single entry point dashboard view, that at-a-glance provides the user key information on one screen. It will provide an easy way for individuals to monitor their KPIs, and for managers to effectively manage their teams’ performance. Information can be filtered by a pre-determined set of filters, is customisable and grants permissions to the individual depending on their role.
Meetings
6
Focus groups
8
Design sprints
8
Prototypes
4
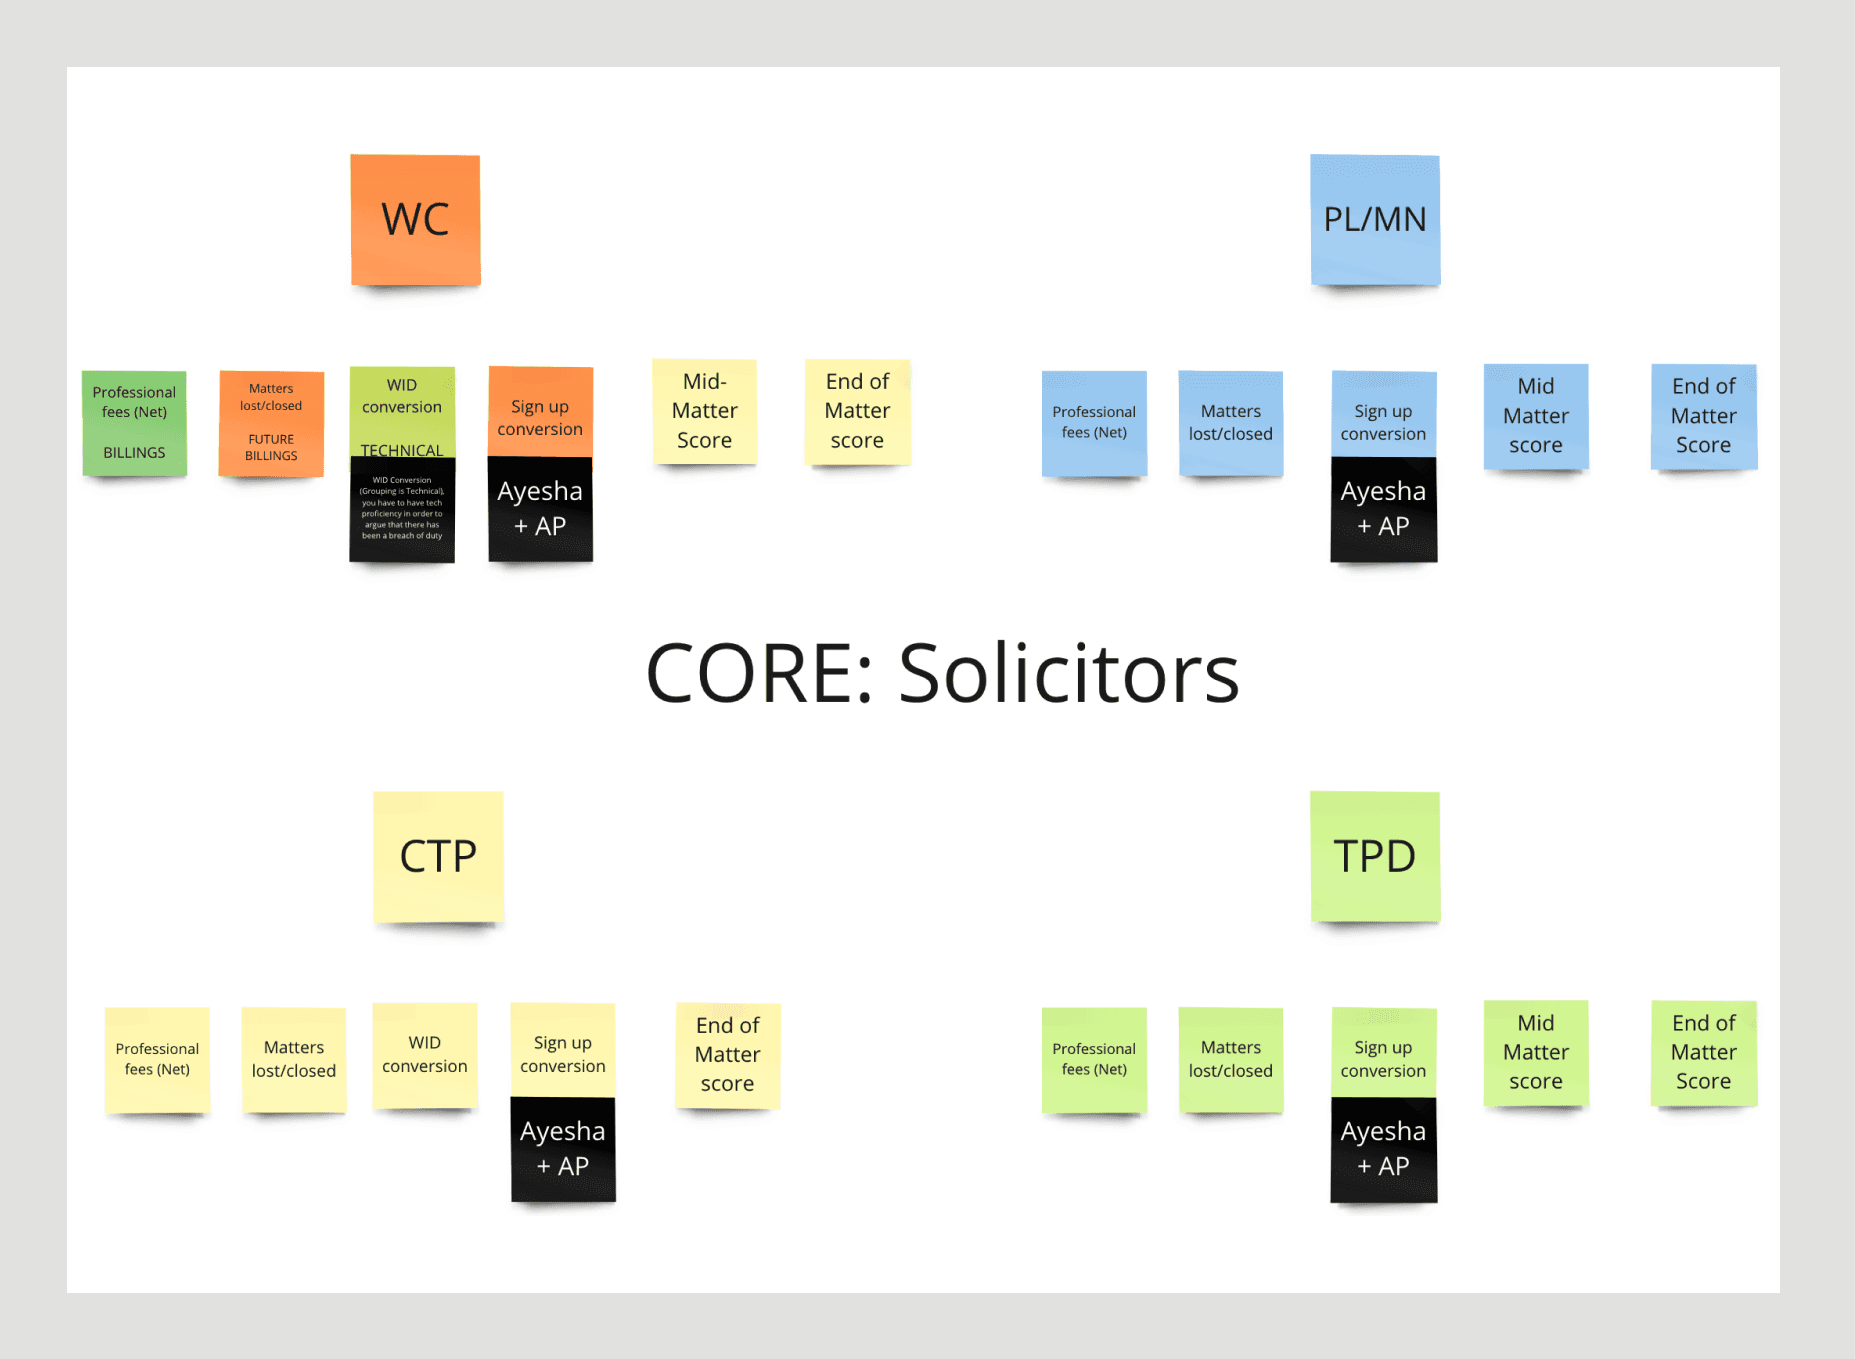
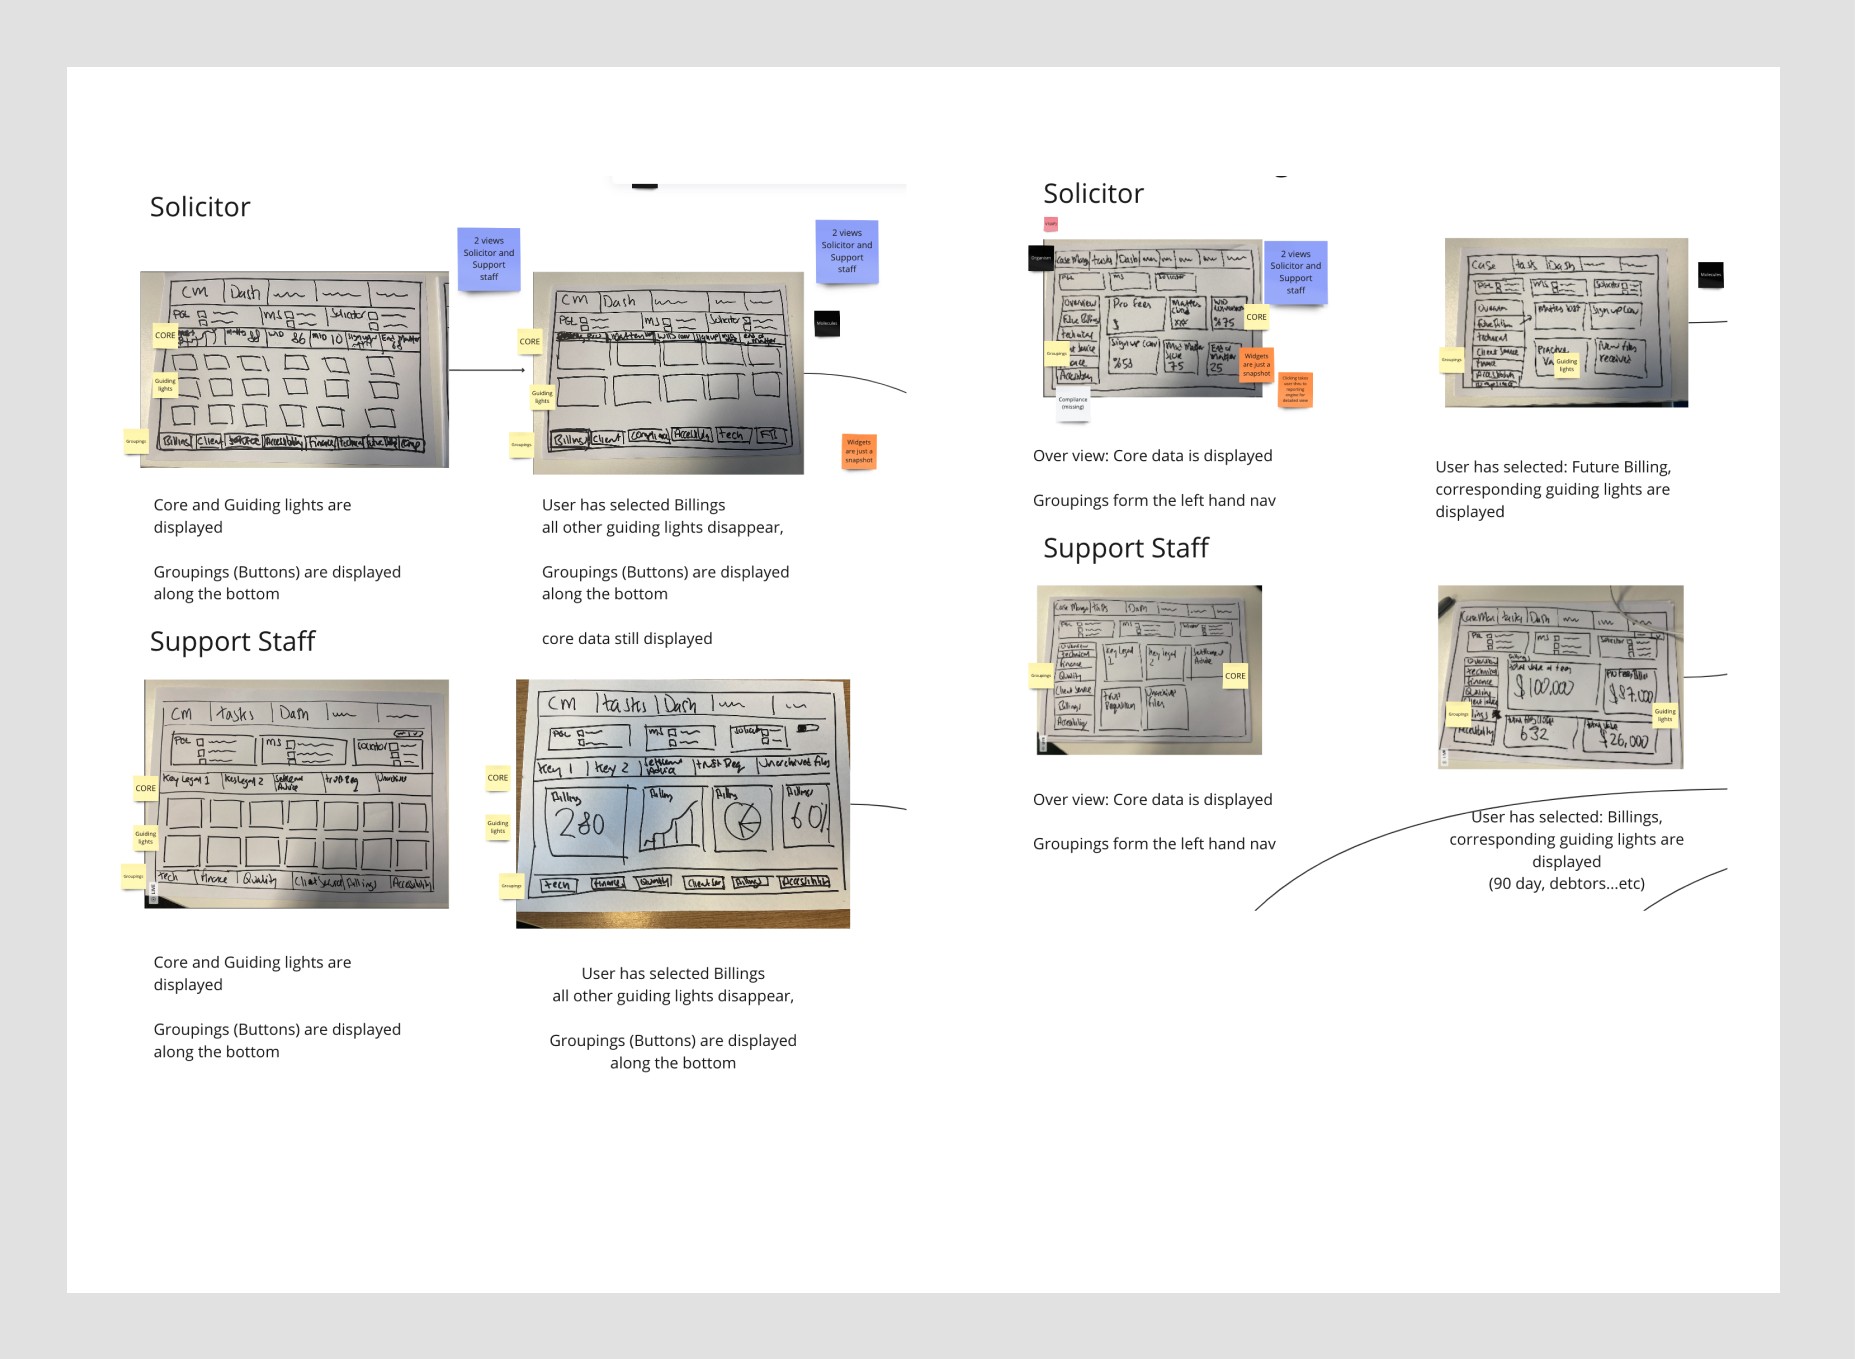
Core metrics
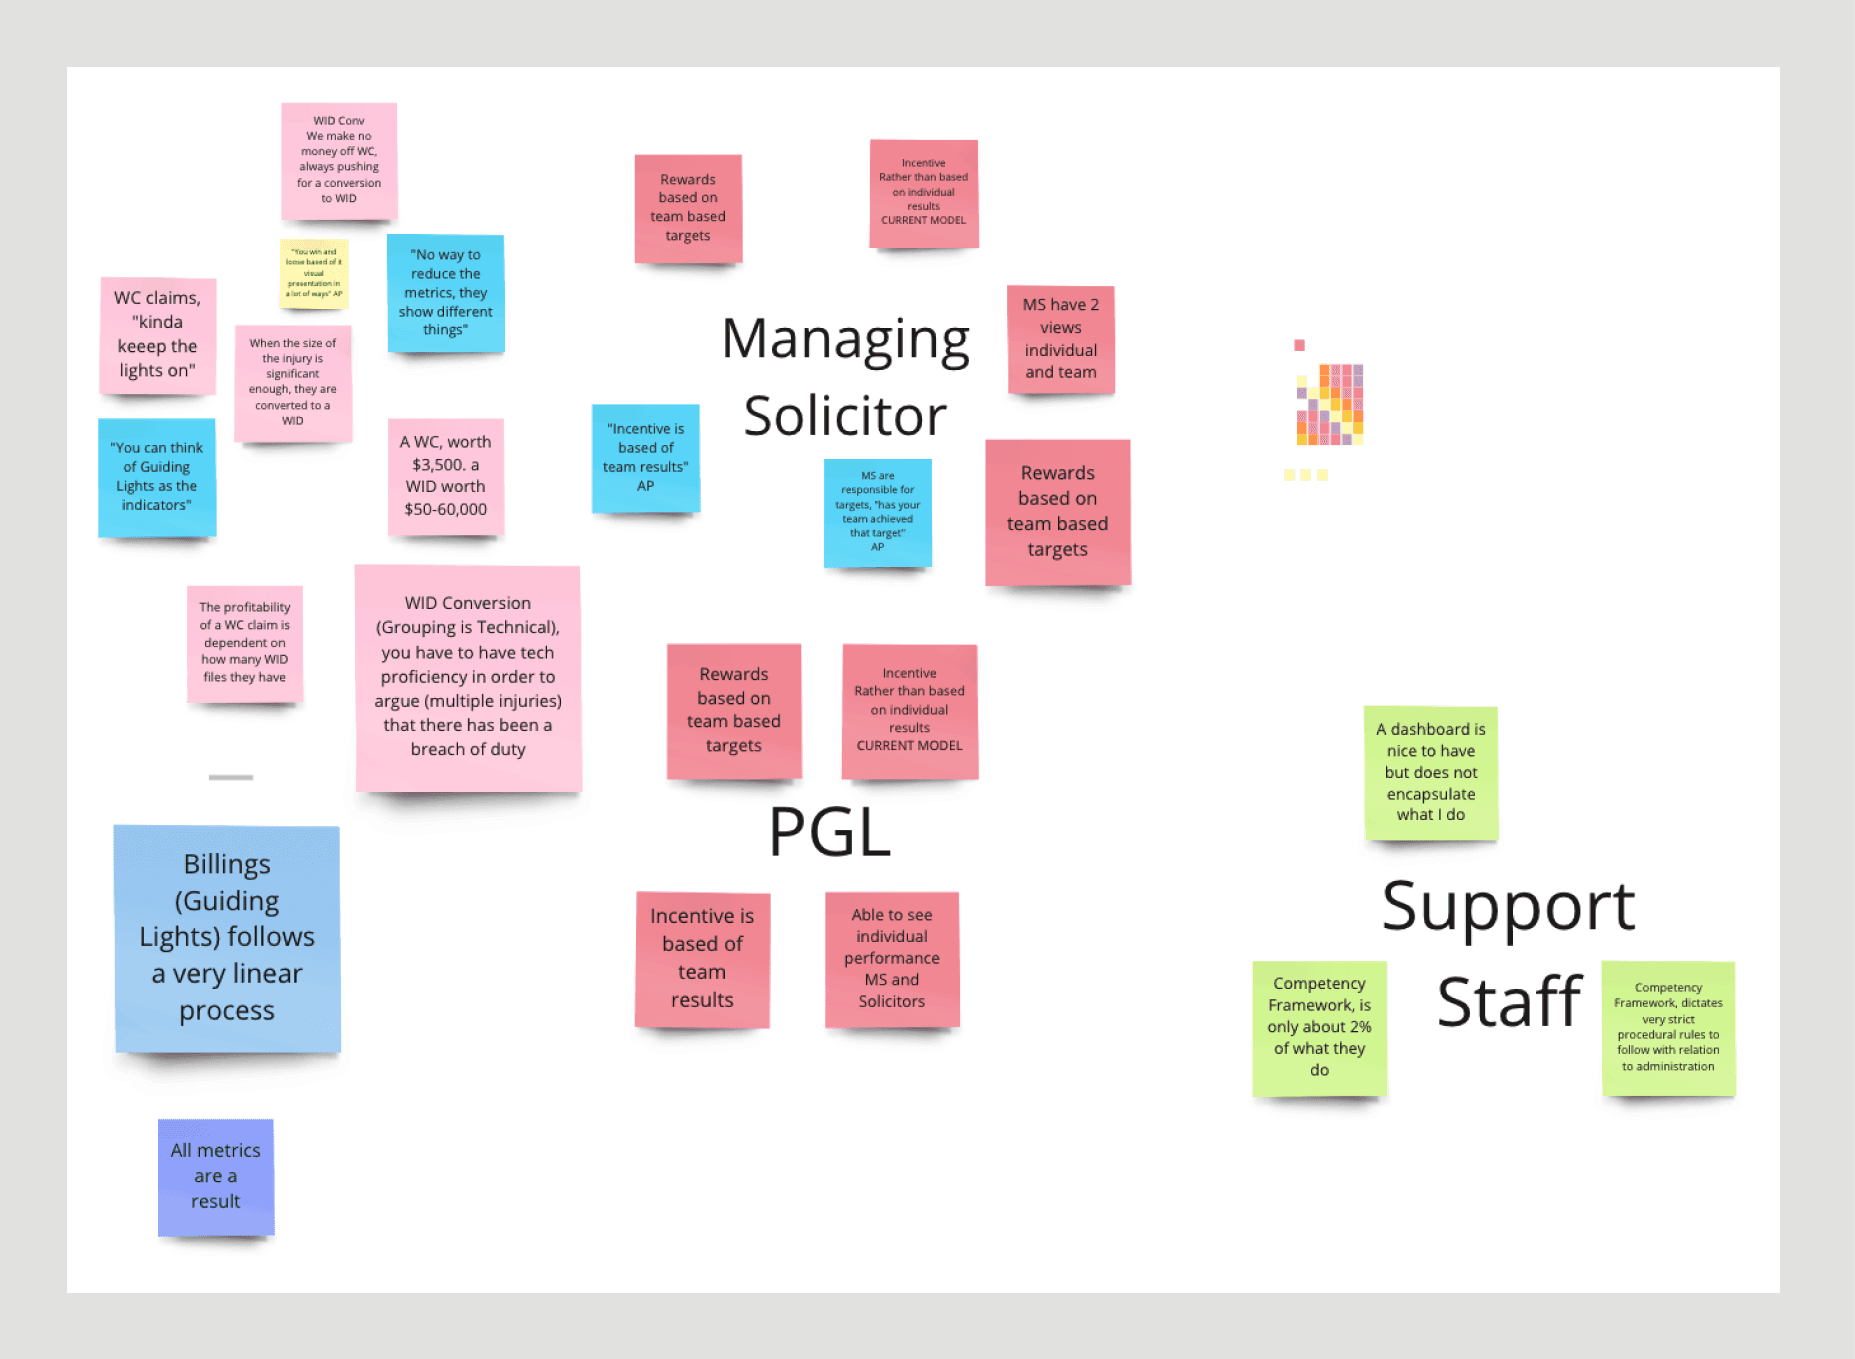
Capturing initial conversations
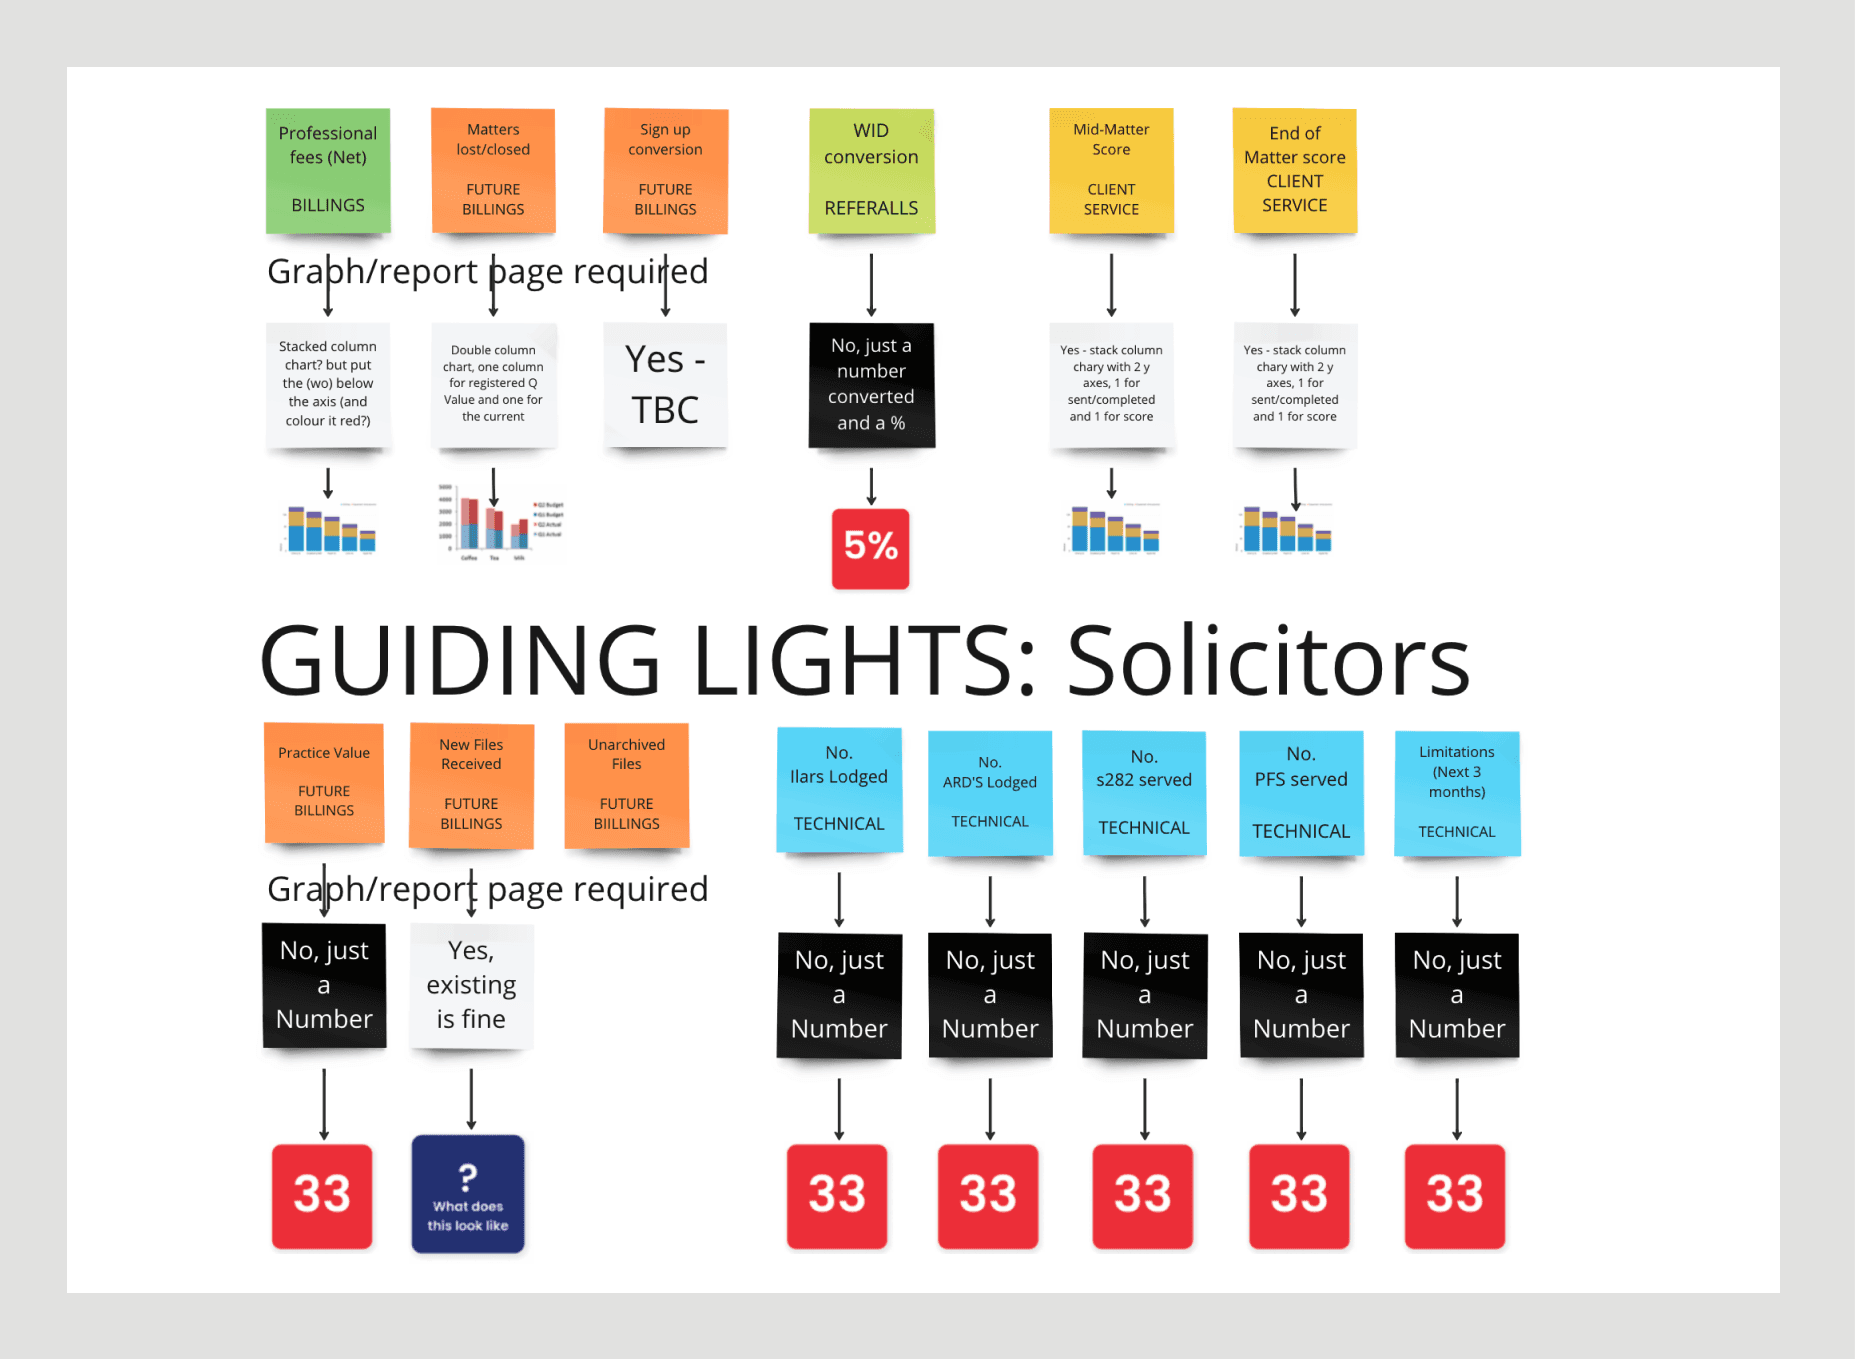
Mapping Guiding Light metrics
Homescreen sketch
Project blockers

Interactive prototype
Billing Metrics
Integrated apps
